Free Headcount Planning Template for Finance Teams [2026]

Every finance team hits a moment where the headcount plan stops making sense.
You built it at the start of the year. It was clean. Department leaders signed off. The numbers tied to the budget. Then Q2 hits, three backfills come in that nobody planned for, engineering opens four new reqs without approval, and suddenly your headcount planning template is a patchwork of overwritten cells, broken formulas, and conflicting versions. You're spending more time fixing the spreadsheet than actually planning.
Here's the thing: a good headcount planning template can carry you surprisingly far. The problem isn't spreadsheets themselves. The problem is that most templates are missing critical components, or they were built for a world where headcount didn't represent 60-70% of operating expenses.
This guide walks you through what a complete headcount planning template should include, the five essential tabs every finance team needs, and how to know when you've outgrown the template entirely. Whether you're building your first version or rebuilding one that's fallen apart, this framework will get you to a place where the numbers actually mean something.
What Makes a Good Headcount Planning Template?
Before diving into specific tabs and formulas, it's worth stepping back and defining what "good" looks like. A headcount planning template isn't a headcount tracker. It's not a hiring plan. It's a financial planning tool that happens to be organized around people instead of line items.
The Three Requirements
A solid headcount planning template needs to do three things simultaneously:
1. Connect headcount to dollars. Every position should carry a fully loaded cost. That means base salary, benefits, taxes, equipment, and any variable compensation. If your template tracks heads but not costs, you're building a roster, not a plan.
2. Show the gap between plan and reality. Static plans are worthless by week six. Your template needs a mechanism to compare what you planned against what actually happened, with enough detail to explain the variance.
3. Support decision-making, not just reporting. The best templates let you ask "what if" questions. What if we delay three hires by a quarter? What if we convert two contractors to full-time? If you can't model those scenarios, you're flying blind during every budget conversation.

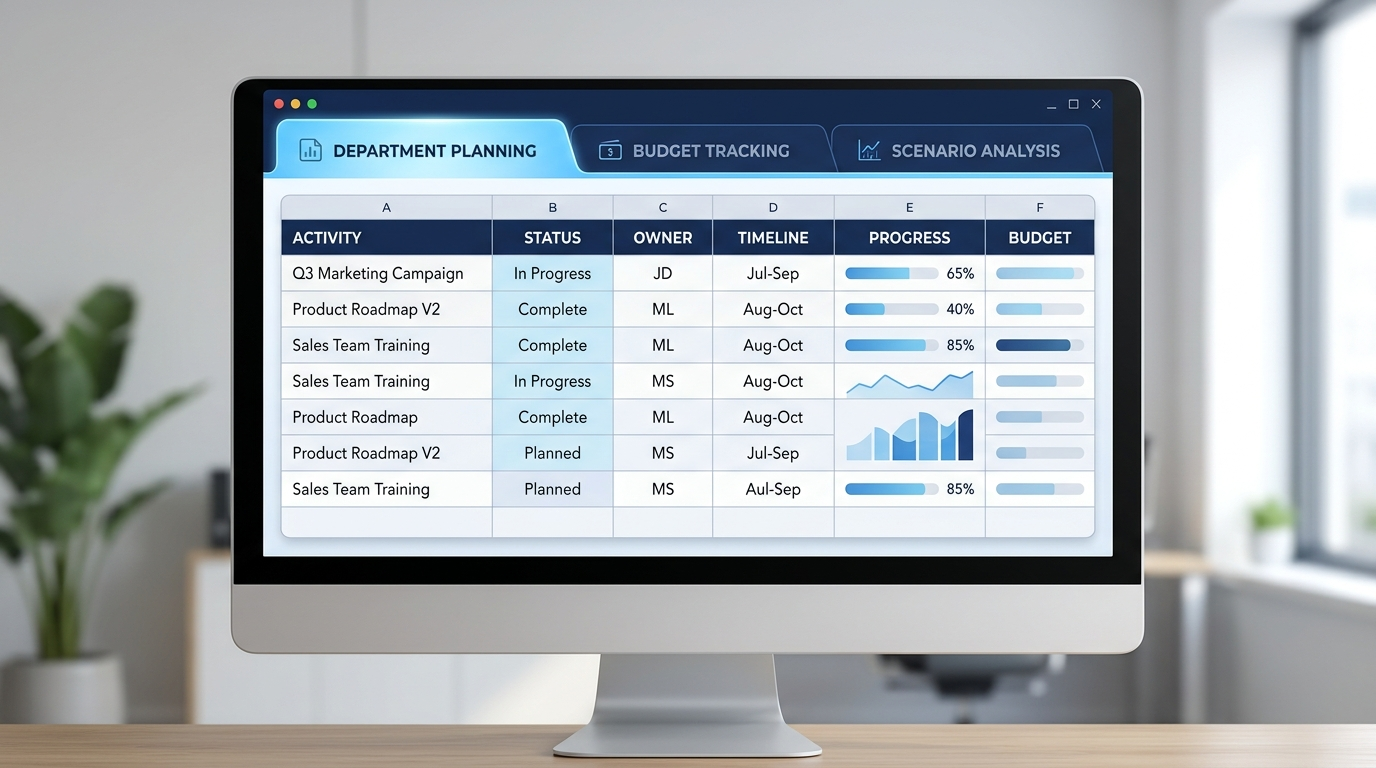
Tab 1: Plan by Department
This is your foundation. The Plan by Department tab breaks your headcount plan into the organizational units that matter for budgeting and accountability.
What to Include
Each row represents a planned position (not a person). Columns should cover:
Department and cost center
Job title and level
Planned start date (month)
Fully loaded annual cost (base + benefits + taxes + overhead)
Monthly cost distribution across the fiscal year
Status (approved, pending, on hold, filled)
Hiring manager
Funding source (existing budget, new budget, reallocation)
How to Structure It
Group positions by department, then by team within each department. Include subtotals at the department level so your CFO can see at a glance: "Marketing plans to add 12 heads this year at a total cost of $2.1M."
One critical detail most templates miss: include a row for each planned position, not just net new heads. Backfills should appear here too, because they carry cost even when headcount stays flat. Gartner reports that 72% of HR and Finance teams don't have shared systems for workforce planning, which means this tab often becomes the only place where both teams agree on the numbers.
Tab 2: Budget vs. Actuals
This is where your template earns its keep. The Budget vs. Actuals tab compares your original headcount plan against what's actually happening in real time.
The Core Comparison
For each department, track three numbers monthly:
Planned headcount: What you said you'd have
Actual headcount: What you actually have
Variance: The gap, with a flag for anything over 5%
Then do the same thing for cost:
Planned cost: The budget you set
Actual cost: What you're spending (including people who came in above or below target comp)
Cost variance: Where you're over or under
Why This Tab Breaks First
Budget vs. actuals is where most spreadsheet-based templates start to crack. The data changes constantly. Someone gets promoted mid-quarter. A contractor converts to full-time. A resignation creates a backfill that's funded differently than the original hire. Each of these events requires manual updates across multiple cells, and when you're managing this across 15 departments, errors compound fast.
This is also where you start to feel the limits of a template. Real-time reconciliation between your HRIS and your plan requires either a dedicated analyst updating the sheet weekly, or a system that does it automatically. Organizations using automated headcount workflows report reducing reconciliation time by up to 89%, which tells you how much manual effort this tab typically demands.
If you're looking for guidance on how Finance teams handle this challenge at scale, it's worth understanding how budget enforcement works as a discipline, not just a spreadsheet exercise.

Tab 3: Scenario Modeling
Every headcount conversation with the board or executive team eventually becomes a "what if" conversation. Your template needs to handle that.
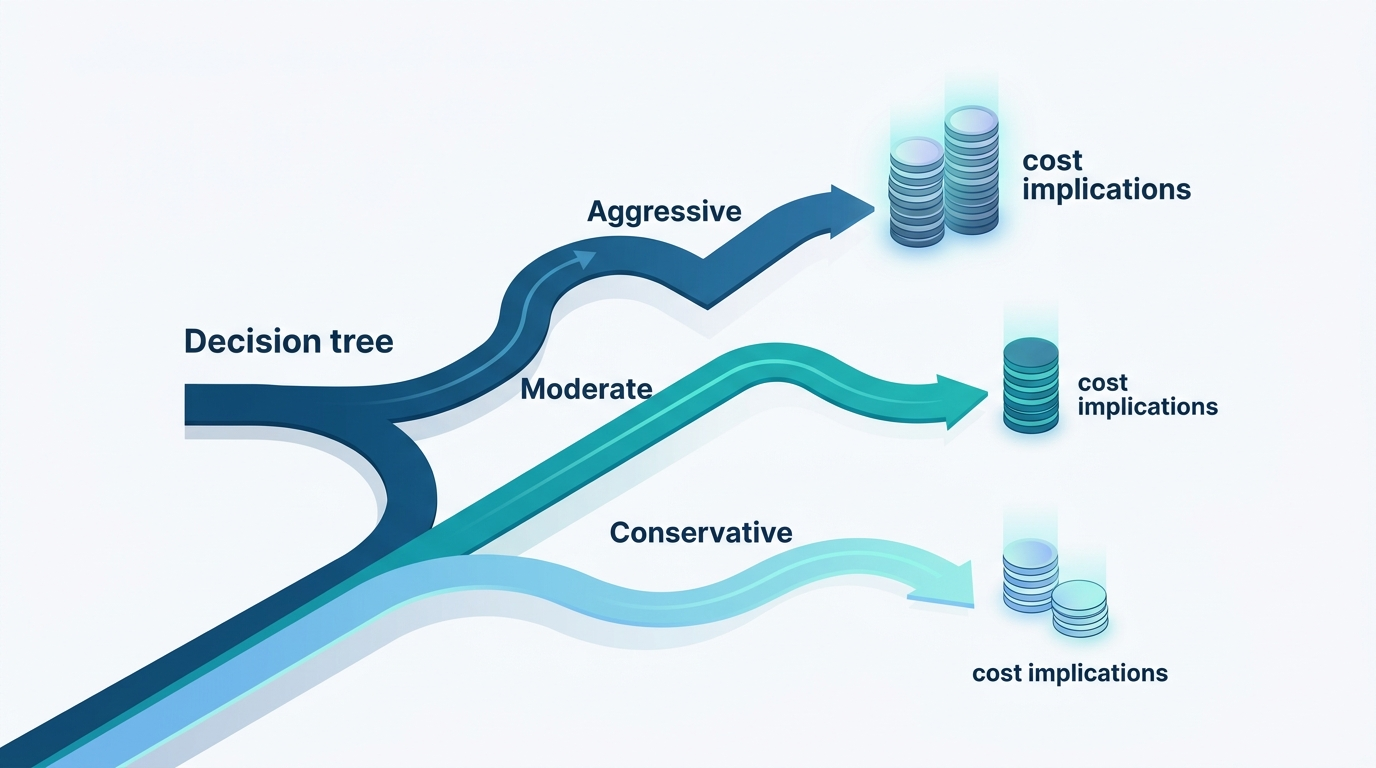
Three Scenarios to Always Have Ready
Build at least three scenarios into your template:
Base case: Your approved plan. This is what the board signed off on.
Conservative case: What happens if you cut 10-15% of planned hires? Which departments absorb the impact? Where do you delay versus eliminate?
Aggressive case: What happens if revenue exceeds plan and you need to accelerate hiring? Where are the bottlenecks? Can recruiting actually deliver 20% more hires in Q3?
Building Scenario Toggles
The simplest approach is a dropdown at the top of your scenario tab that switches between cases. Each scenario adjusts start dates, position counts, or compensation assumptions. The formulas cascade through, showing you the financial impact of each path.
For most teams, scenario modeling in a spreadsheet works until you need more than three scenarios or need to model changes at the individual position level.
Tab 4: Rolling Forecast
Your annual plan is a starting point. Your rolling forecast is what you actually manage to.
How It Works
A rolling forecast extends your headcount view 12-18 months forward, regardless of fiscal year boundaries. Every month, you drop the completed month from the back and add a new month to the front. This means you're always looking at least a year ahead.
What to Track
Projected headcount by department (updated monthly)
Projected fully loaded cost
Key assumptions (attrition rate, time-to-fill, average comp by level)
Confidence level for each quarter (high/medium/low)
The Attrition Factor
Here's where most headcount plans go wrong: they model additions but ignore departures. If your average annual attrition is 15%, you need to plan for roughly 1.25% of your workforce turning over every month. That means backfill costs, recruiting spend, and productivity gaps that your budget needs to absorb.
Build an attrition assumption into your rolling forecast. McKinsey research shows that 40-65% of management time gets consumed by planning coordination. A rolling forecast that accounts for attrition reduces the number of surprise conversations with your CFO about unplanned backfills. For a deeper look at how headcount governance connects planning to execution, that's a useful starting point.
Tab 5: Board Summary
Your board doesn't want to see 15 department tabs and 200 rows of position data. They want a single page that answers four questions.
The Four Board Questions
1. Are we on plan? Show total headcount: planned vs. actual, with variance.
2. What are we spending? Show total people cost: budget vs. actual, with variance.
3. Where are we investing? Show headcount growth by function as a percentage of total.
4. What's the outlook? Show the rolling forecast for the next two quarters with confidence levels.
Formatting for the Board
Use charts, not tables. A waterfall chart showing how you went from January headcount to current headcount (adds, departures, transfers) is more valuable than a grid of numbers. A stacked bar chart showing investment by function over time tells the growth story.
Keep this tab read-only. It should pull from Tabs 1-4 automatically. The moment someone starts manually editing the board summary, your data integrity disappears.
For teams building board-ready reporting, the Kinnect platform automates this entire layer so your board deck is always current without a last-minute scramble.
Do I Really Need All Five Tabs?
Yes. The five tabs work together as a system. Skip Budget vs. Actuals, and you're planning in a vacuum. Skip Scenario Modeling, and you can't respond to board questions without a week of scrambling. Skip the Rolling Forecast, and you lose visibility the moment Q1 ends. Remove one tab, and the others lose context.
What About Integrating With Our HRIS?
Your headcount planning template shows you the plan. Your HRIS (Workday, BambooHR, etc.) shows you reality. The gap between them is where headcount errors, budget overruns, and ghost reqs live.
A spreadsheet can bridge that gap for a while. You export data from Workday, paste it into your actuals column, and compare. But that comparison is only as good as the last time someone ran the export. For a deeper look at this challenge, the Headcount Governance Playbook covers the full picture.
When Does a Template Stop Working?
Templates work well for companies under 500 employees with relatively stable headcount. Once you cross a few thresholds, the cracks become unavoidable:
More than 10 departments submitting headcount requests
Multiple approval layers (manager, VP, Finance, HR)
Frequent mid-cycle changes (reorgs, backfills, transfers between cost centers)
Board-level reporting requirements that demand real-time accuracy
Workday or another enterprise HRIS as your system of record
At that point, the question isn't whether your template is good enough. It's whether the manual effort to maintain it is worth the cost. When companies reach this stage, Kinnect becomes the natural next step, replacing the spreadsheet with a system that enforces budget controls, automates reconciliation, and keeps Finance, HR, and Recruiting aligned on a single headcount number.
Conclusion
A well-built headcount planning template with these five tabs gives your finance team a real framework for managing your largest expense line. Start with Plan by Department to establish the foundation. Build Budget vs. Actuals to stay honest. Add Scenario Modeling to stay ready. Maintain a Rolling Forecast to stay ahead. And create a Board Summary that tells the story without the noise.
The template works until it doesn't. And when your organization reaches the point where maintaining the spreadsheet costs more than the clarity it provides, that's exactly the problem Kinnect was built to solve.
Book a demo with Seena to see how Kinnect replaces the template with a system that scales.