Headcount Planning for FP&A: Beyond the Budget Spreadsheet

At Google, the FP&A team had Adaptive Planning for revenue forecasting. They had Workday for HR data. They had custom dashboards for everything from cloud infrastructure spend to travel and entertainment.
And they had a Google Sheet with 47 tabs for FP&A headcount planning.
I'm not exaggerating. Forty-seven tabs. One for each department, sub-department, and cost center. Manual VLOOKUP formulas chaining data from tab to tab. A color-coding system where green meant "budgeted," yellow meant "pending approval," orange meant "backfill," and red meant "over budget." The logic behind the colors? Only one analyst understood it. She'd built the system over two years, tweaking formulas and adding conditional formatting until the sheet was a masterwork of spreadsheet engineering.
When she went on parental leave, nobody could update the headcount forecast for three weeks.
Three weeks. The most sophisticated finance organization I'd ever worked with, managing billions in revenue, couldn't produce an updated headcount forecast because the knowledge lived in one person's head and one person's spreadsheet.
That's not a people problem. That's a systems problem. And it's the same systems problem I've seen at every company since, from Slack to Coinbase to the mid-market companies I work with today through Kinnect.
The FP&A team isn't managing headcount in spreadsheets because they want to. They're doing it because nobody built a system that speaks their language.
Tired of the 47-tab spreadsheet? Download the free FP&A Headcount Planning Template to bring structure to your headcount forecast. Or book a demo with Seena to see what headcount planning looks like when it's built for Finance.

Why FP&A Still Lives in Headcount Spreadsheets
Here's the uncomfortable truth: 96% of FP&A professionals still use spreadsheets for planning. Not because spreadsheets are the right tool. Because the alternatives weren't built for Finance.
HR systems track headcount as people. Recruiting systems track headcount as requisitions. Neither tracks headcount as cost. And cost is the language FP&A speaks.
When Finance looks at headcount, they don't see 487 employees. They see $58.4 million in fully loaded annual labor cost, allocated across 12 cost centers, with variance against a plan that was approved in Q4 and has already drifted by 6%. They need to know not just how many people the company has, but what those people cost, where that cost sits in the budget, and how the forecast changes when you add, remove, or delay a hire.
No HR system provides that view. No ATS provides that view. So FP&A builds it themselves. In a spreadsheet.
Gartner's 2026 CFO priorities research confirms why this matters: 56% of CFOs rank enterprise-wide cost management as a top-five priority, while 51% rank improving financial forecast accuracy in their top five. Headcount is 60 to 70% of operating expense. If you can't forecast headcount accurately, you can't forecast costs accurately. And if you can't forecast costs accurately, the CFO's two biggest priorities are both at risk.
The gap isn't effort or intent. FP&A teams are working hard to manage headcount. The gap is infrastructure. There's no system that connects headcount to budget at the level of detail Finance requires.
That's why the spreadsheet persists. It's the only tool flexible enough to model headcount the way FP&A needs to model it. The problem is that flexibility comes with fragility: version control issues, formula errors, single points of failure, and data that's stale the moment it's entered.
If your team is still wrestling with this, you're not behind. You're dealing with a structural gap that most organizations share. These headcount planning best practices can help you work within the current constraints while you build toward something better.
What FP&A Actually Needs from Headcount Planning
HR cares about headcount as a number. Finance cares about headcount as a cost.
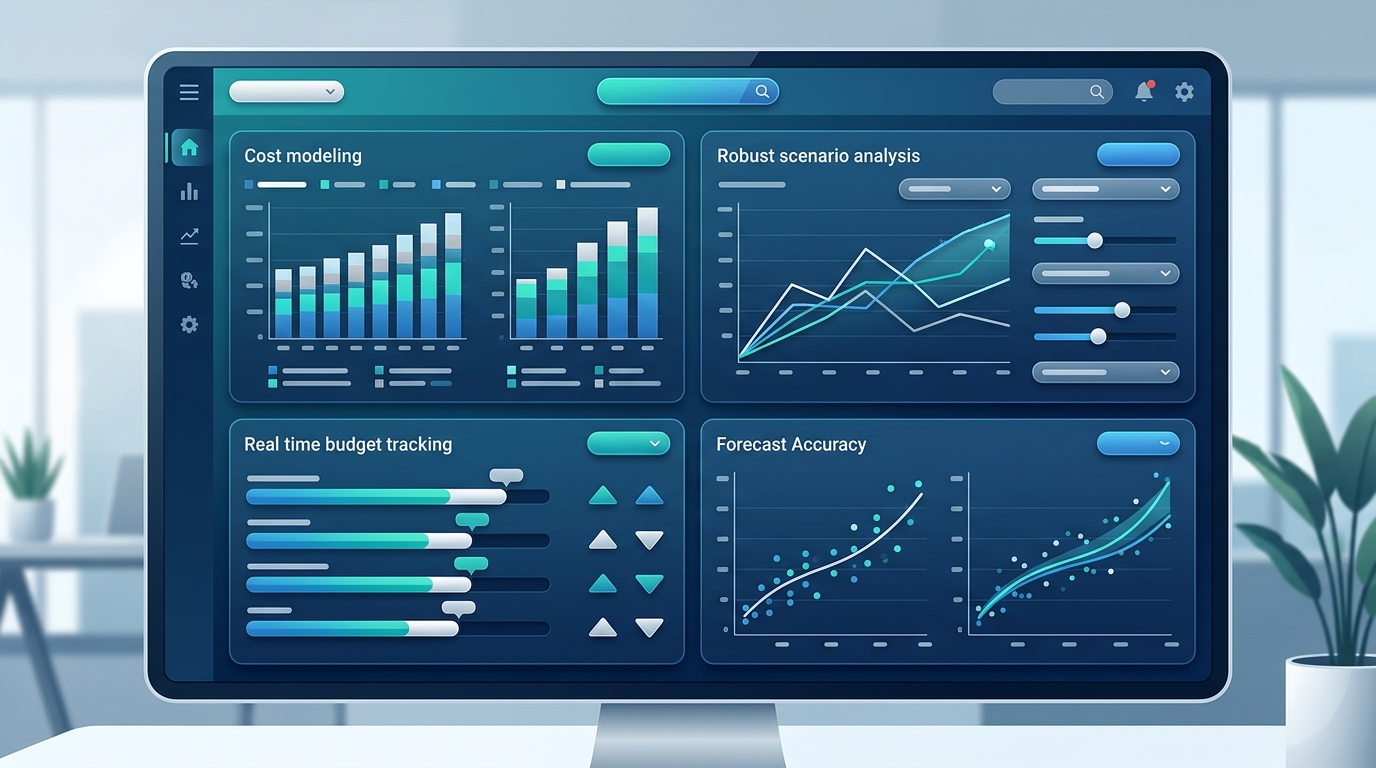
Fully Loaded Cost Modeling (Not Just Headcount Counts)
HR cares about headcount as a number. Finance cares about headcount as a cost.
When FP&A models a new hire, they need the full picture: base salary, payroll taxes (8 to 10% of base), health benefits (another 8 to 10% or a fixed dollar amount per employee), equity grants, bonus targets, equipment, workspace costs, and any department-specific overhead. A $130,000 base salary is a $185,000 to $200,000 fully loaded cost. That delta matters when you're planning across 500 positions.
Most headcount planning tools show you the headcount number. FP&A needs the fully loaded cost attached to every single position, at every stage from "planned" through "filled," updated as compensation data changes.
Scenario Modeling Tied to Budget
FP&A doesn't plan in a single line. They plan in scenarios.
What happens to the budget if we hire 10 fewer engineers in Q2? What if we accelerate 20 sales hires into Q1 instead of spreading them across the year? What if attrition runs 2% higher than expected? Each scenario has a headcount impact and a budget impact. FP&A needs to see both, simultaneously, and compare them against the approved plan.
Scenario modeling with financial context is the difference between "we're thinking about hiring fewer engineers" and "if we delay 10 engineering hires by one quarter, we save $1.2M in fully loaded cost this fiscal year, with a projected $800K revenue impact in Q4." The second version is what the CFO needs to make a decision.
Real-Time Actuals vs. Plan
Most FP&A teams reconcile headcount actuals against the plan monthly. Some do it quarterly. A few brave souls attempt it weekly.
None of those cadences are fast enough.
When a hire starts two weeks early, or a departure happens mid-month, or a backfill gets approved at a higher level than the original position, the plan is already wrong. FP&A finds out when they pull the next report. By then, the variance has been compounding for days or weeks.
Real-time reconciliation means the actuals-vs.-plan view is always current. Not "as of last Tuesday." Always.
Rolling Forecast Integration
Annual budgets are necessary. But FP&A knows the annual budget is wrong by February.
The standard in 2026 is the 12-to-18-month rolling forecast, updated monthly or even weekly. Headcount planning needs to plug directly into that rolling forecast. When a new position is approved, it should automatically extend into future periods. When a hire is delayed, the forecast should adjust. When attrition spikes, the rolling forecast should reflect the cost impact without someone manually updating a formula.
If headcount planning lives in a separate spreadsheet from the rolling forecast, someone has to manually bridge the two. That bridge is where errors live and where FP&A teams spend hours every budget cycle.
Board-Ready Reporting on Demand
Every quarter, FP&A goes through the same ritual: pull headcount data from multiple systems, reconcile discrepancies, format it for the board deck, and hope the numbers still hold by the time the presentation happens.
Board-ready headcount reporting should be a byproduct of good planning infrastructure, not a separate workstream. If the plan, the actuals, and the variance are all maintained in one governed system, the board report generates itself.

The FP&A Headcount Planning Framework
After building headcount planning processes at Google, Slack, and Coinbase, and then rebuilding them at dozens of companies through Kinnect, I've distilled the FP&A approach into five steps. This isn't a theoretical framework. It's the sequence that works.
Step 1: Start with Budget, Not Headcount Count
Most headcount planning starts in the wrong place. It starts with "how many people do we need?" instead of "how much can we spend on people?"
The difference matters. When you start with headcount count, every department submits a wish list. Engineering wants 15 new hires. Sales wants 20. Product wants 8. The total always exceeds the budget. Then Finance plays the bad guy, cutting headcount after departments have already anchored to their numbers. That creates friction and erodes trust.
When you start with budget, the conversation changes. "Engineering has $4.2M in new headcount budget for the year. At an average fully loaded cost of $210K per engineer, that's 20 positions. How does Engineering want to allocate those 20 positions across teams and levels?"
The headcount number falls out of the budget, not the other way around. Finance sets the financial constraint. Departments decide how to use it. That's budget enforcement at the point of planning, not at the point of conflict.
Step 2: Model Fully Loaded Costs for Every Position
Every position in your headcount plan needs a fully loaded cost, not just a salary estimate.
Here's the framework I use:
Component 1: Direct Compensation
Base salary + bonus target + equity (annualized) + signing bonus (amortized over expected tenure)
Component 2: Benefits and Taxes
Health/dental/vision + 401(k) match + payroll taxes (FICA, FUTA, state) + disability/life insurance
Component 3: Operational Overhead
Equipment + workspace allocation + software licenses + department-specific tools
Component 4: Ramp and Transition Costs
Recruiting cost (amortized) + onboarding time (productivity ramp) + training investment
For a mid-level software engineer in the Bay Area, the math typically looks like this: $160K base + $32K bonus + $50K equity = $242K direct comp. Add $45K in benefits/taxes and $18K in overhead, and the fully loaded cost is $305K. That's nearly double the base salary. Planning on base salary alone will put you 40%+ over budget before you even start.
Connect your cost models to real compensation data from Workday to keep assumptions current.
Step 3: Build Scenarios with Financial Impact
FP&A lives in scenarios. Your headcount plan should too.
At minimum, build three:
Base Case: The approved plan. This is your committed headcount, aligned to the annual budget, with monthly or quarterly hiring targets.
Growth Case: What happens if revenue exceeds forecast and the business accelerates hiring? Model the additional headcount, the fully loaded cost, the cash impact by quarter, and the break-even timeline for each incremental hire.
Reduction Case: What happens if revenue misses forecast and you need to slow or freeze hiring? Model the positions you'd defer first, the cost savings by quarter, and the operational impact of running leaner.
Each scenario needs to show the headcount impact and the budget impact side by side. "We'd add 15 heads" means nothing without "at a fully loaded cost of $3.8M, increasing Q3-Q4 burn by $950K per quarter."
Scenario modeling in hours, not weeks, is what separates reactive finance teams from strategic ones.
Step 4: Connect Plan to Actuals in Real Time
The plan is only useful if you can measure against it.
This is where most FP&A teams lose the thread. The plan lives in one system (or spreadsheet). The actuals live in another (Workday, the ATS, payroll). Connecting the two requires manual pulls, data transformation, and reconciliation. By the time the comparison is ready, it's already a week old.
Here's what real-time connection looks like:
When a hire starts, the actual cost populates against the planned position automatically
When a position is vacated, the variance updates immediately
When a backfill is approved at a different level or comp, the forecast adjusts
When a hiring timeline slips, the cash flow projection reflects the delay
This isn't aspirational. Kinnect customers report 100% elimination of manual data reconciliation between systems. The plan-to-actuals view stays current because the systems feeding it are connected, not manually bridged.
Step 5: Automate the Variance Report
The variance report is FP&A's most important headcount deliverable. It's also the most painful to produce.
In most organizations, the monthly variance report requires pulling headcount data from the HRIS, pulling cost data from payroll, pulling forecast data from the planning tool, aligning all three datasets on a common structure (department, cost center, position level), and then calculating the variance at every level.
That process takes 8 to 15 hours per month. Every month.
Automate it. When the plan and actuals live in the same governed system, variance calculates itself. The report is always current. The FP&A team spends time analyzing the variance, not building the report.
Organizations that automate this process report saving 80% of the time previously spent on administrative headcount tasks. That's not a small efficiency gain. That's the difference between an FP&A team that produces reports and an FP&A team that provides strategic guidance.
For more on reducing time spent on headcount management, explore these common mistakes to avoid.
Put the framework into practice. The FP&A Headcount Planning Template gives you structured tabs for each of these five steps, ready to use in Excel or Google Sheets. Or book a demo with Seena to see the framework running in a system, not a spreadsheet.

Common FP&A Headcount Planning Mistakes
Why do FP&A teams consistently underestimate headcount costs?
Because they plan on base salary instead of fully loaded cost. A $130K hire isn't a $130K expense. After payroll taxes, benefits, equity, and overhead, that hire costs $185K to $200K. Multiply that 30 to 50% delta across 100 planned hires, and you're looking at $5M to $7M in unplanned spend. Every time.
The fix is straightforward: model fully loaded costs from day one. Build your cost assumptions into the planning template so every position automatically calculates at fully loaded, not base. And update your assumptions quarterly, because benefits costs and tax rates change.
Deloitte's research on finance transformation found that 34% of finance leaders are taking a larger role in hiring decisions. That expanded role is partly driven by this exact problem. Finance is stepping in because the cost implications of headcount decisions are too significant to leave unmodeled.
Why does the headcount forecast break by February?
Because the plan was built as a static document, not a living model. Annual headcount plans are negotiated in Q4, approved in January, and outdated by February. Departments change priorities. Markets shift. Key people leave. New initiatives emerge.
The fix: treat your headcount plan as a rolling forecast. Update it monthly. Connect it to actuals so you can see drift in real time. Build scenarios for the changes you can anticipate, and have a governance process for the changes you can't.
IBM's FP&A trends research for 2026 reinforces this shift toward continuous planning cycles, where planning is a living process rather than an annual event.
How do you reconcile Finance headcount numbers with HR headcount numbers?
You don't. Not manually, at least. If reconciliation requires a person opening two systems, pulling data into a spreadsheet, and finding the discrepancies, it will always be late and frequently wrong.
The answer is a shared system, or connected systems, where Finance and HR are looking at the same headcount data with the same definitions. When Finance counts funded positions and HR counts active employees, they'll never match. You need a unified view that shows both perspectives against the same underlying data.
Gartner reports that 72% of HR and Finance teams don't have shared systems for workforce planning. That statistic explains why reconciliation is the most time-consuming task in FP&A headcount planning. The solution isn't better reconciliation. It's eliminating the need for it.

From Spreadsheet to System: What the Transition Looks Like
Moving from a spreadsheet to a governed headcount planning system isn't a six-month transformation project. It's a focused implementation with a clear sequence.
Week 1: Connect your data sources. Integrate your HRIS (Workday, in most cases) and your ATS (Greenhouse, SmartRecruiters, iCIMS, Ashby) to create a single source of truth for headcount data. Kinnect's no-code integrations make this a configuration exercise, not a development project. No custom middleware. No IT backlog.
Weeks 2-3: Build your cost model and scenarios. Configure fully loaded cost assumptions by level, department, and geography. Build your base case, growth case, and reduction case scenarios with financial impact. Import your current plan as the baseline.
Week 4: Train and validate. Give Finance, HR, and Recruiting access to the same platform. Validate the data against your current spreadsheet (they should match, and if they don't, the discrepancies will tell you where your spreadsheet was wrong). Train the team on how to use the real-time hiring tracker and variance reporting.
Weeks 5-6: Go live with governance. Turn on approval workflows, budget enforcement, and real-time reconciliation. Every headcount decision now flows through a governed process with cost context. The spreadsheet becomes a backup, then a reference, then an artifact.
Kinnect customers complete this transition in 5 to 6 weeks, not months. And the results are immediate: $75,000+ saved annually on integration costs, 100% elimination of manual reconciliation, and an 89% reduction in reconciliation time.
The question most FP&A teams ask isn't "should we move beyond the spreadsheet?" They already know the answer. The question is "how painful is the transition?" The answer, if you're working with purpose-built infrastructure, is "less painful than another quarter of managing your largest expense in a 47-tab spreadsheet."
For a deeper look at how integration architecture supports this transition, read about building your single source of truth and the key decisions around position management vs. job management.
Your FP&A Headcount Plan Starts Here
FP&A teams manage headcount in spreadsheets because no system was built for them. Not because they lack sophistication. Not because they don't know better. Because the tools available were designed for HR workflows, not financial planning.
That's changing. The framework in this post, start with budget, model fully loaded costs, build scenarios, connect to actuals, automate variance, gives FP&A a path from reactive headcount tracking to strategic workforce planning. Whether you implement it in a spreadsheet or a purpose-built system, the approach works.
But the spreadsheet has limits. When the analyst who built it goes on leave, when the formulas break, when reconciliation takes longer than analysis, when the board asks a question nobody can answer in real time, those limits become costs.
The organizations that govern headcount with the same rigor they apply to every other financial decision will control their largest expense with confidence. The ones that keep patching the 47-tab spreadsheet will keep discovering the cost of fragility at the worst possible moments.

Stay ahead of FP&A headcount planning trends. Subscribe to the Kinnect newsletter for insights on headcount planning, workforce governance, and financial planning from operators who've been in the trenches Subscribe
Related Resources
What Is Headcount Governance?
4 Proven Best Practices for Workday Headcount Planning
5 Common Workday Headcount Management Mistakes
Choosing Workday Position Management vs. Job Management
Workday Integration Architecture: Building Your Single Source of Truth
Download the Headcount Governance Playbook